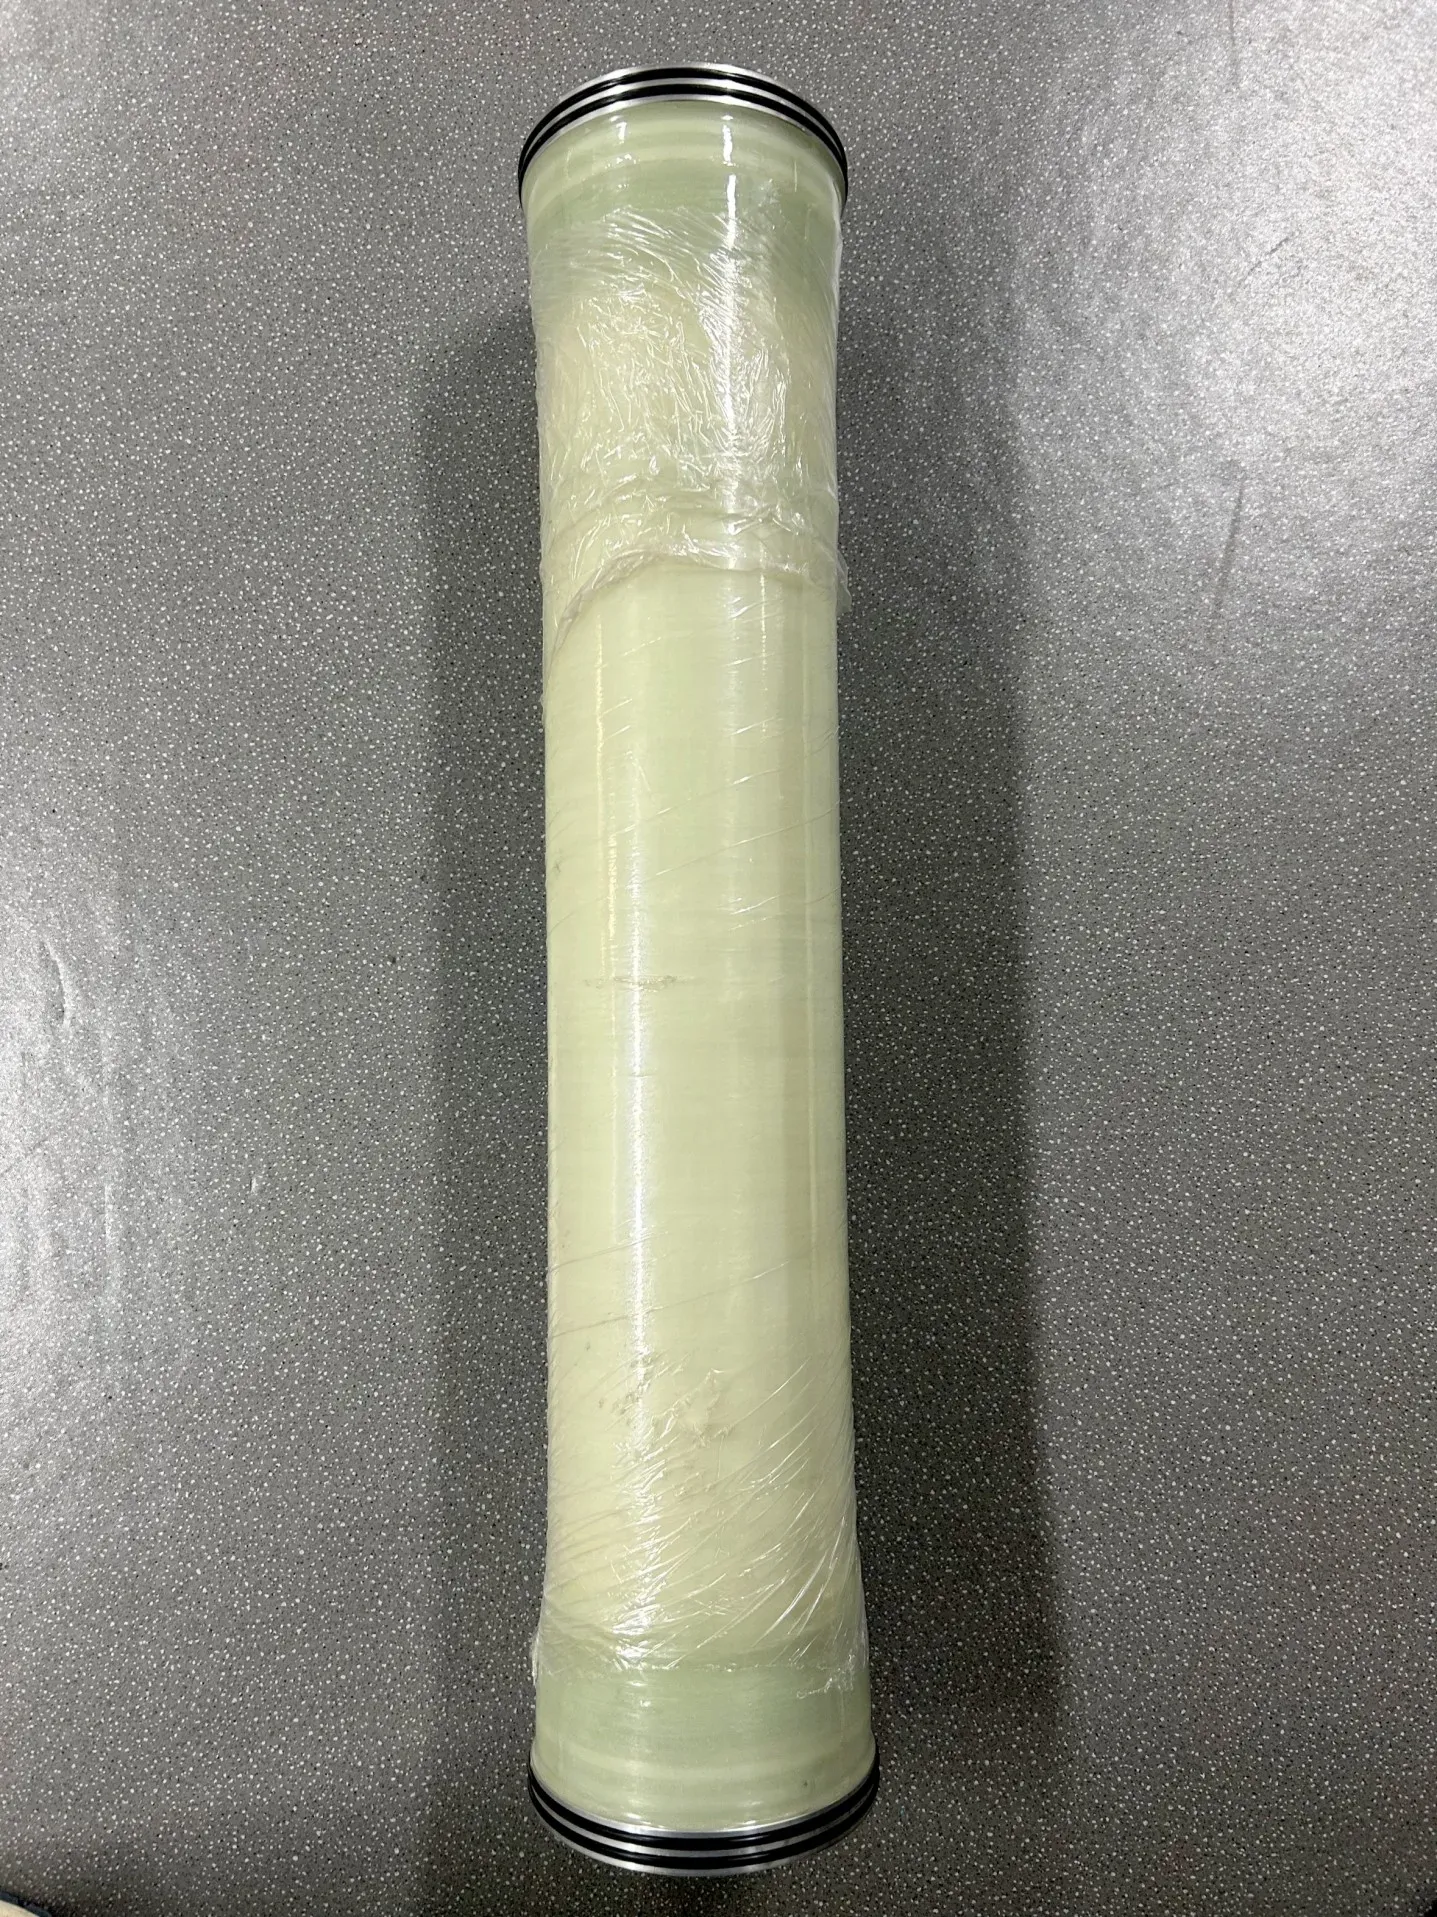
How to monitor the permeate side pressure of the membrane separation device? Answer: Stare at two leading indicators-permeate side pressure and permeate gas flux. When a pollution layer appears on the membrane surface, the osmotic side pressure goes up first and the flux goes down later, and the changes of both indicators are earlier than the emission concentration exceeds the standard, which is the golden window for decision-making according to the trend. The practice is to record and draw trend charts regularly, replace single-point judgment with baseline comparison, arrange cleaning if there is continuous deviation, and wait for emission alarm. This paper describes the monitoring methods, trend interpretation and timing of cleaning.
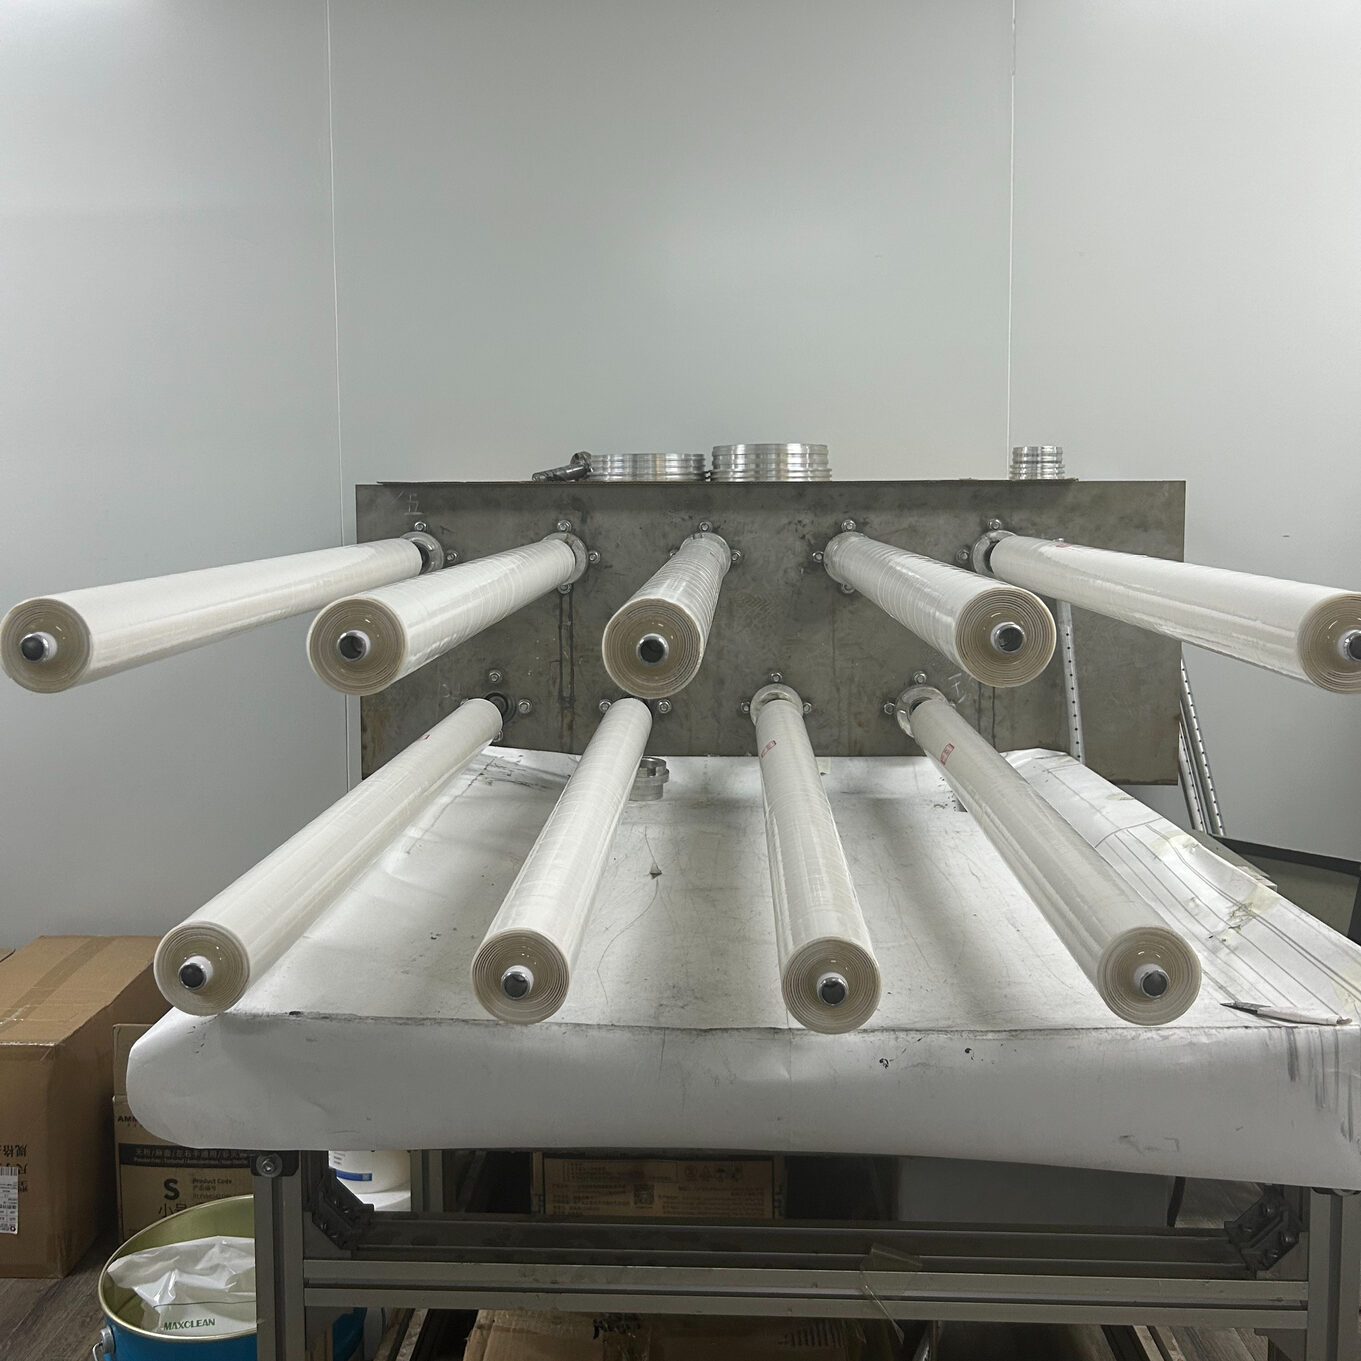
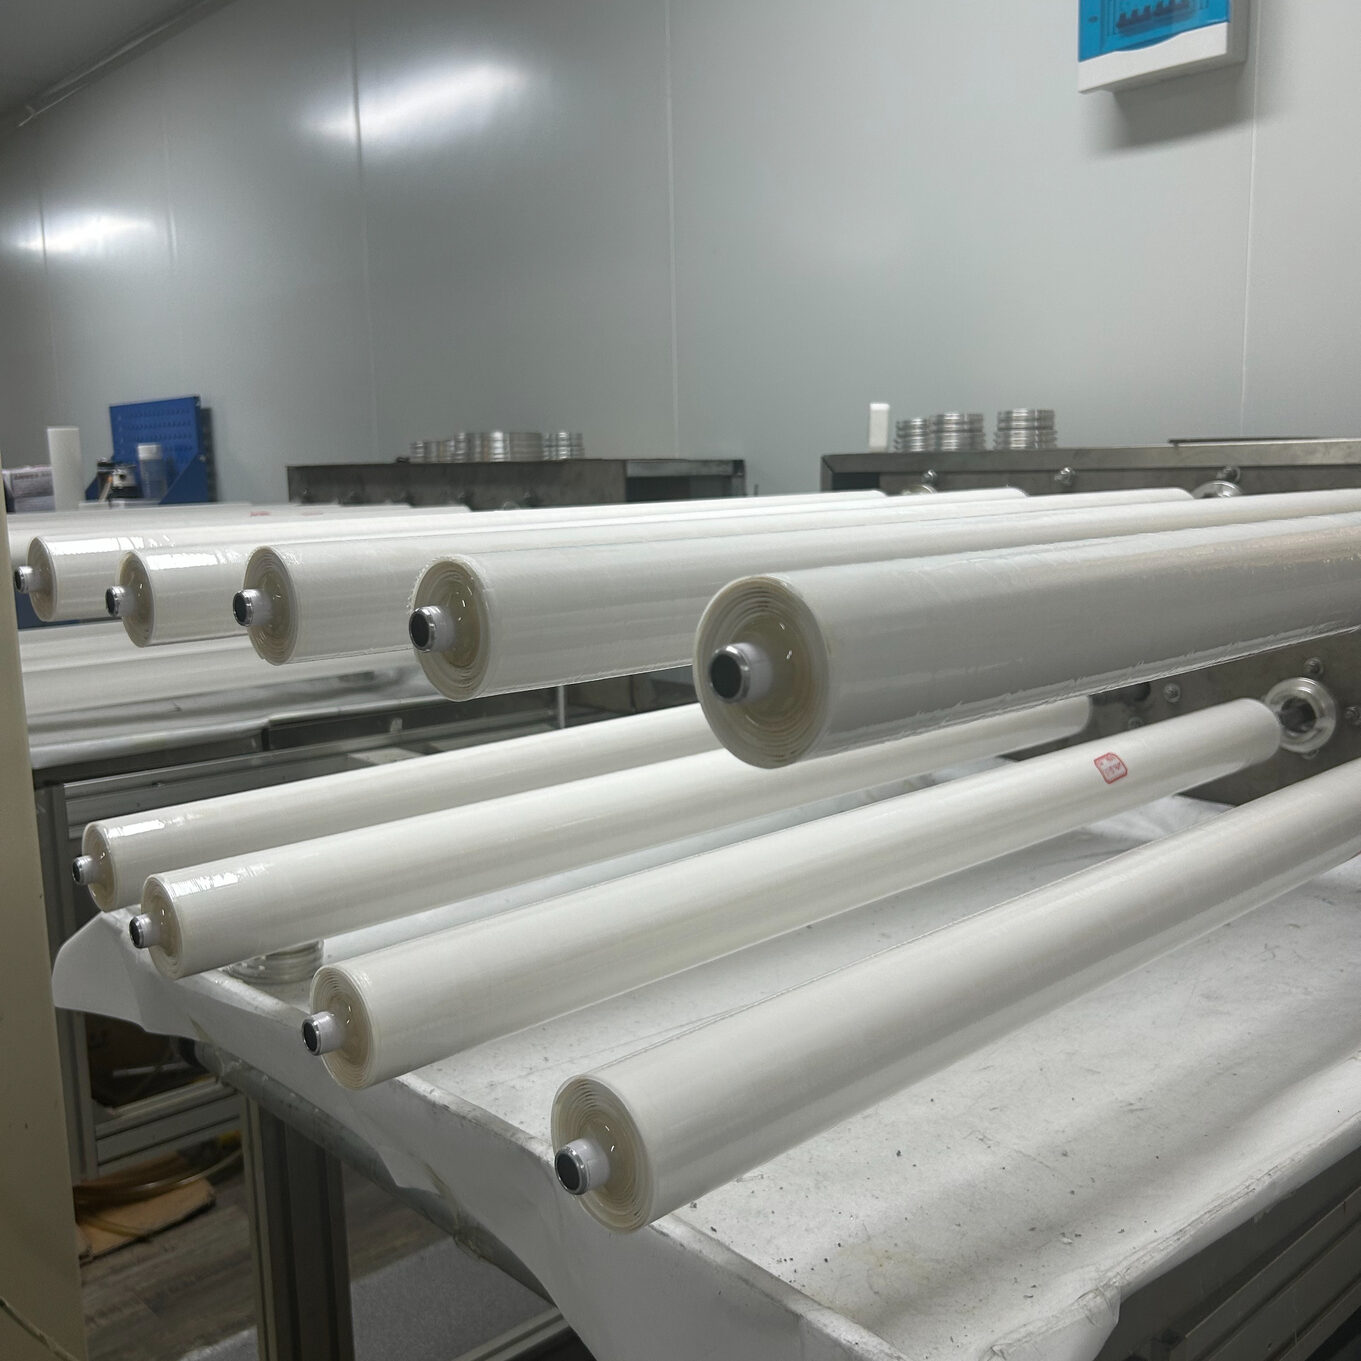
The driving force of membrane separation comes from the pressure difference between the two sides of the membrane: the inlet side is pressurized, the permeation side is exhausted under vacuum or normal pressure, and the oil and gas molecules are trapped and enriched by the membrane. Once the pollution layer is formed on the membrane surface, the permeation channel is blocked, and the direct performance is the pressure on the permeation side and the flux attenuation. The advantage of these two parameters is sensitivity-when the emission concentration is still in the qualified range, the flux may have dropped by 20%; The disadvantage is that it is easy to be ignored. The site is used to staring at the emission data and waiting for the concentration alarm to act, which often misses the best cleaning window. Incorporating the parameters of the penetration side into the daily records is a typical practice of exchanging early warning with small costs.
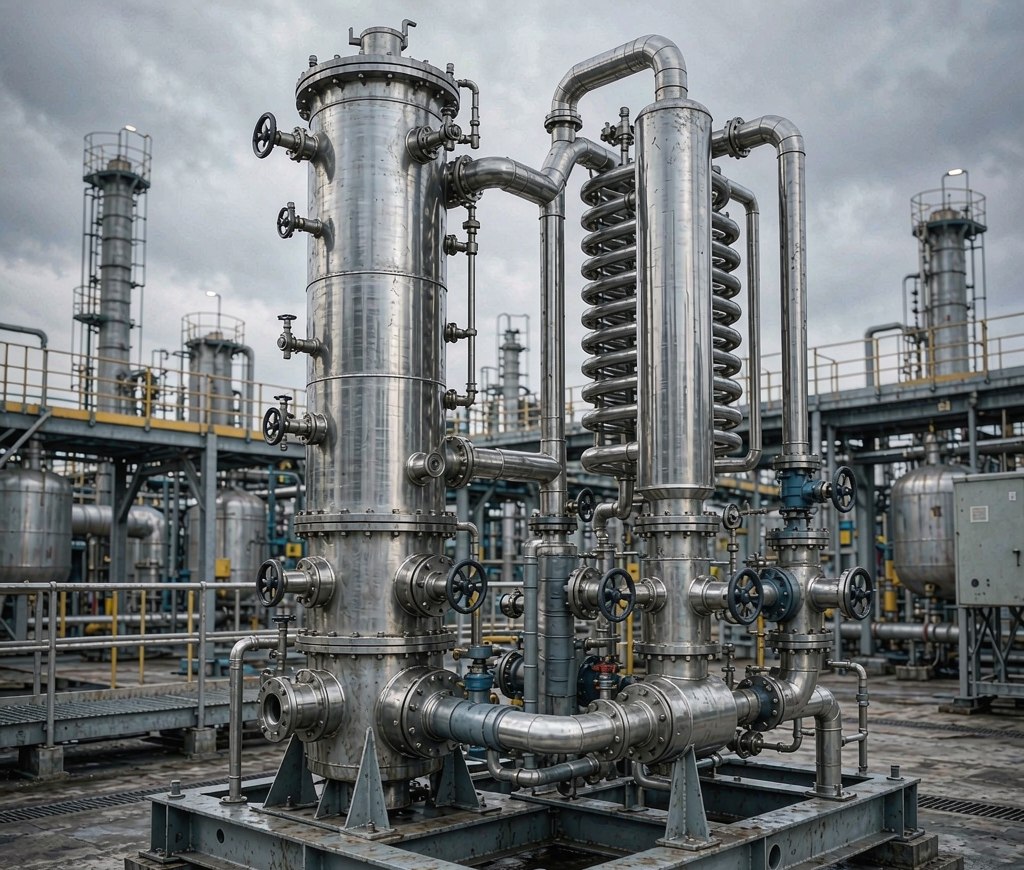
The hardware requirements for monitoring are not high: the penetration side-mounted pressure gauge or pressure transmitter, the intake side-mounted flow meter, and the two readings plus operating conditions (concentration, temperature, vacuum) are a complete set of records. The recording frequency shall be determined according to the working conditions, once a week under stable working conditions, and it shall be encrypted to every day during season change or process adjustment period. Drawing a trend graph is the key action: the single point value is greatly disturbed by the working conditions of the day, and the trend line reflects the true state of the membrane. Baseline data is extracted from the initial stage of operation or the stable period after cleaning, and is used as the benchmark for all subsequent comparisons. Sites without baselines are rebuilt from this round of stable operation data.
The formula for judging is that the pressure goes up and the flux goes down at the same time, and it is treated according to membrane pollution. Only when the flux drops and the pressure is stable, first check the fluctuation of concentration and vacuum degree on the intake side. Only when the pressure rises and the flux is stable, first check whether the instrument and pipeline are blocked. The early cleaning recovery of pollution is obvious, and the recovery range of two consecutive cleaning is decreasing, indicating that the pollution is irreversible, and the replacement plan is made. Temperature factors should be eliminated: high intake air temperature in summer will change the separation selectivity. Temperature correction should be taken into account when comparing trends, and seasonal fluctuations should not be misjudged as membrane faults.
The timing of cleaning depends on the trend inflection point: the flux drops by more than 20% from the baseline, or the osmotic side pressure continues to deviate from the upper limit, and chemical or physical cleaning is arranged. The cleaning method is selected according to the pollution type: physical cleaning and targeted chemical cleaning are used for sludge and dust pollution. After cleaning, the flux and pressure difference must be remeasured, and the recovery range must be confirmed by comparing the baseline. The cleaning parameters shall be implemented according to the regulations given by the membrane supplier. If the concentration, temperature and time exceed the limit, the membrane will be damaged. After recovery, update the baseline and trend graph and enter the next monitoring cycle.
| Monitoring Items | normal trend | pollution signal | Priority Action |
|---|---|---|---|
| osmotic side pressure | Fluctuation around baseline | Continuous Uplift Deviation | Check by pollution |
| permeate gas flux | Stable at baseline | Continued downward | Synchronous pressure check |
| emission concentration | Qualified interval | rising trend | End Issue Handling |
| Intake air temperature | Within the design scope | seasonal deviation | Contrast after correction |
| Vacuum degree | Stability | Fluctuation or attenuation | Check the vacuum system |
| Cleaning recovery range | Close to baseline | successive decrement | By replacement plan |
Starting from the current stable working condition: continuously record the normal operation data for two to four weeks, and take the average value of the stable section as the temporary baseline; The earlier you start, the more reliable the subsequent trend judgment will be. It is more realistic to make up for the failure while running than to make up for it later.
First, eliminate false signals: fluctuation of intake air concentration, attenuation of vacuum degree and drift of instrument will all change flux readings; Look at the working condition data together to confirm that it is the trend of the membrane body and then arrange cleaning to avoid invalid shutdown.
Depending on the working conditions, it can usually be used for several years under standard maintenance. The judgment is based on the gradual decrease and trend performance of the cleaning recovery range, not a fixed number of years. Spare parts should be advanced according to the shutdown window before life to avoid forced shutdown.
This article by LuoyangWohong PetrochemicalEquipment Co., Ltd. arranges that the company provides design, manufacturing and operation and maintenance services for condensation recovery, membrane separation recovery and complete solvent recovery devices for chemical and pharmaceutical enterprises. If you need process evaluation or scheme configuration, please contact and exchange.
Mr. Li 13526990215

Hotline